Line
Pronunciation: /laɪn/ Explain
|
A line is a straight, one-dimensional figure. The term one-dimensional means that the line has no thickness, only length. A line has no endpoints, meaning it goes on infinitely it goes on forever. A straight one-dimensional object which has one endpoint is called a ray. A straight, one-dimensional object which has two endpoints is called a line segment. See figure 1. An endpoint is a point on the end of a ray or line segment. In Elements Euclid defined a straight line as, "A straight line is a line which lies evenly with the points on itself." This statement seems to confuse more than explain. This demonstrates the difficulty in defining base concepts. In modern Euclidean geometry, 'straight' means what we usually mean by the word straight. It goes on without curving. However, in spherical geometry, straight means that, though the line follows the curve of the surface of the sphere, as in figure 2, it does not turn to the left or the right. |
|
Related Words
- Linear: Having to do with a line.
- Linear Equation: A linear equation represents a line.
- Linear System: A linear system is a set of related linear equations.
Article Contents
- Properties of Lines in Euclidean Geometry
- Slope of a Line
- Parallel Lines
- Intersecting Lines
- Perpendicular Lines
- Skew Lines
- Vertical Lines
- Horizontal Lines
- Slope Intercept Form of Linear Equations
- Point Slope Form of Linear Equations
- Rays
- Constructing a Line Segment Given a Line Segment and an Endpoint
- Table of References
- More Information
- Table of Figures
Properties of Lines in Euclidean Geometry
A line is uniquely determined by two points.
The word "uniquely" means that two points can determine only one line. Any line that passes through the two points must be the same line. See Euclid's Elements, Book 1, Postulate 1
Two lines in the same plane either intersect once or are parallel.
Two straight lines can not intersect twice. If two figures intersect twice, at least one must curve.
Two lines in three or more dimensions intersect, are parallel, or are skew.
Equations of Lines
An equation that represents a line is called a linear equation. There are several customary forms of linear equations:
ax + by = c Standard form: This is used when representing linear systems. This form is also called the general form of a linear equation. y = ax Direct variation: This form is used when y changes in proportion with x. y = ax + b Slope intercept form: a is the slope of the line and b is the y-intercept. y - y1 = a(x - x1) Point slope form: (x1, y1) is any point on the line, a is the slope of the line. y = a Horizontal line passing through the y-axis at (0, a). x = b Vertical line passing through the x-axis at (b, 0).
Slope of a Line
|
The slope of a line is the ratio of the rise of the line divided by the run. The rise refers to the vertical distance between any two distinct points and run refers to the horizontal distance between the same two points. Slope is also called the rate of change. In cases of direct variation, the slope is also called the constant of variation. How to Calculate the Slope of a LineTo calculate the slope of a line, first identify the coordinates of any two distinct points. The coordinates of the lower left point in figure 3 are (0, -1). Call this (x1, y1). The coordinates of the upper right point in figure 3 are (1, 1). Call this (x2, y2). It doesn't matter which point is called (x1, y1) and which is called (x2, y2). The answer will come out the same. The formula for the slope is a = (y2 - y1)/(x2 - x1). Substituting the points from figure 3 into the formula, we get a = (1 - (-1)) / ( 2 - 0 ). Simplifying the numerator and denominator, we get a = 2 / 2 = 1. So the slope of the line in figure 3 is 1.
|
Rate of Change for Lines
When relating linear equations to the real world, the term rate of change is often used. This means that given a change in the independent variable (x), one can apply the rate of change as a ratio to find the change in the dependent variable (y).
 Understanding Check
|
The table in figure 5 shows a graph of the total cost of gasoline as a function of the number of gallons pumped. Read each question, and write your answer on a piece of paper.
|
Note: The term "rate of change" has a similar, but not identical, meaning when applied to non-linear equations.
Teachers, see also Rate of Change Lesson by Cynthia Lanius.
Parallel Lines
|
In Euclidean geometry, two lines are parallel if they do not intersect5. In metric geometry, parallel lines have the same slope. Since the two lines have the same rate of change, for the same change in x the change in y will be identical. So the lines will always be the same distance apart and will never intersect. |
Intersecting Lines
|
Two lines intersect if they cross each other. Another way to look at it is; two lines intersect if they have exactly one point in common. In figure 7, the two lines intersect. Since figure 7 is two dimensional and the lines do not have the same slope, they have to intersect. Properties of Intersecting Lines in Euclidean Geometry
How to Find the Coordinates of the Intersection of LinesTo find the point at which two lines intersect, use substitution:
|
Perpendicular Lines
|
Two lines are perpendicular if they intersect at right angles (see Euclid. Elements Book 1 Definition 10. Translated by D. Joyce.). A right angle is 90° = π / 2 radians. In diagrams, right angles are denoted with a small square. See figure 9. In metric geometry, you can tell if lines are perpendicular from the slopes. If m1 is the slope of one line, and m2 is the slope of a line perpendicular to the first, then m1 = -1 / m2.
|

Skew Lines
|
Skew lines are lines that do not intersect and are not parallel6. In a two dimensional Euclidean plane, lines either intersect or are parallel, so skew lines do not exist in two dimensional space. Skew lines exist only in spaces with three or more dimensions. Manipulative shows a pair of skew lines in a simulated three dimensional space. Click on the blue point and drag it to animate the space. |
Vertical Lines
|
A line is vertical if it goes straight up and down. A vertical line is used for the y axis when graphing. The equation of a vertical line is in the form x = a where a is the x-intercept. |
Horizontal Lines
|
Horizontal lines go from side to side. One way to remember this is to remember that the horizon is horizontal. The equation of a horizontal line is used for the y = b where b is the y-intercept. |
Slope Intercept Form of Linear Equations
|
Slope-intercept form of a linear equation is y = mx + b. m is the slope of the line. b is the y-intercept of the line. A vertical line can not be represented in slope intercept form. Click on the points of the sliders in manipulative 2 and drag them to change the figure. |
Point Slope Form of Linear Equations
|
The point-slope form of a linear equation is y - y1 = a (x - x1), where (x1, y1) is any point on the line and a is the slope of a line. A vertical line can not be represented in point slope form. For example, if the point (1, 2) is on a line with the slope 3, then the equation of the line can be written y - 2 = 3(x - 1). |
Rays
|
A ray is a part of a line with one end point. In the
other direction, the ray goes on forever, just like a line. Draw a ray with a dot at
one end representing the end point and a line radiating from the other end. To show
that one end of a ray goes on forever, draw an arrow (see figure 15). To write down
a ray with endpoint A and a point
B on the ray, Write
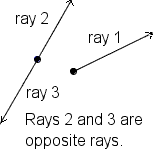
Coterminal rays are rays that share a common endpoint (see figure 16). Opposite rays are rays with an endpoint in common that go in opposite directions. Two rays are parallel if they are contained by the same line or lines that are parallel. |
|
 with the arrow over the top. Another word that means the same thing as ray is

How to Construct a Line Segment Given a Segment and an Endpoint
Manipulative 4 will help visualize Euclid's proof of constructing
a line segment the same size as an existing line segment at an existing point.
To change the manipulative at each step, click on the blue points and drag them.
To reset the manipulative to its original condition click on the reset
 button in the manipulative window. To show the changes
for each step, click on the 'show' button for each step.
button in the manipulative window. To show the changes
for each step, click on the 'show' button for each step.
|
|
Table of Figures
| Figure | Description |
| Figure 1 | A line, ray and line segment |
| Figure 2 | A line in spherical geometry |
| Figure 3 | Slope of y = x - 1 |
| Figure 4 | Slope of y = 2x + 1 |
| Figure 5 | Rate of Change |
| Figure 6 | Parallel lines |
| Figure 7 | Intersecting lines |
| Figure 8 | Perpendicular lines |
| Figure 9 | Small square denoting a right angle |
| Figure 10 | Skew lines |
| Figure 11 | Vertical lines |
| Figure 12 | Horizontal lines |
| Figure 13 | Slope-intercept form |
| Figure 14 | Point-slope form |
| Figure 15 | Rays |
| Figure 16 | Coterminal Rays |
References
- McAdams, David E.. All Math Words Dictionary, line. 2nd Classroom edition 20150108-4799968. pg 108. Life is a Story Problem LLC. January 8, 2015. Buy the book
More Information
- Euclid of Alexandria. Elements. Clark University. 9/6/2018. https://mathcs.clarku.edu/~djoyce/elements/elements.html.
Cite this article as:
McAdams, David E. Line. 4/24/2019. All Math Words Encyclopedia. Life is a Story Problem LLC. https://www.allmathwords.org/en/l/line.html.Image Credits
- All images and manipulatives are by David McAdams unless otherwise stated. All images by David McAdams are Copyright © Life is a Story Problem LLC and are licensed under a Creative Commons Attribution-ShareAlike 4.0 International License.
Revision History
4/24/2019: Changed equations and expressions to new format. (McAdams, David E.)12/21/2018: Reviewed and corrected IPA pronunication. (McAdams, David E.)
8/31/2018: Removed broken links, updated license, implemented new markup, implemented new Geogebra protocol. (McAdams, David E.)
8/7/2018: Changed vocabulary links to WORDLINK format. (McAdams, David E.)
10/11/2010: Added coterminal, parallel, and half-line to Rays section. (McAdams, David E.)
12/5/2008: Added formal definition of endpoint. (McAdams, David E.)
11/19/2008: Changed manipulatives to GeoGebra. Added javascript support for construct a line segment manipulative (McAdams, David E.)
6/7/2008: Corrected spelling errors. (McAdams, David E.)
3/11/2008: Corrected bad link for ray. (McAdams, David E.)
8/28/2007: Add reference to Euclid's. (McAdams, David E.)
8/22/2007: Add Article Contents. (McAdams, David E.)
8/21/2007: Add construction of a line given a line and an endpoint. (McAdams, David E.)
8/14/2007: Initial version. (McAdams, David E.)
- Navigation
- Home
- Contents
-
# A B C D E F G H I J K L M N O P Q R S T U V W X Y Z - Teacher Aids
- Classroom Demos
- How To
- LIASP
- LIASP Home
- Conditions of Use
- Privacy Policy
- Donate to LIASP
- Help build this site
- About LIASP
- Contact LIASP
All Math Words Encyclopedia is a service of
Life is a Story Problem LLC.
Copyright © 2018 Life is a Story Problem LLC. All rights reserved.
This work is licensed under a Creative Commons Attribution-ShareAlike 4.0 International License