Quartile
Pronunciation: /ˈkwɔr.taɪl/ Explain
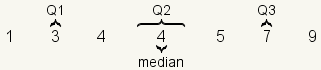
| | Figure 1: Quartiles |
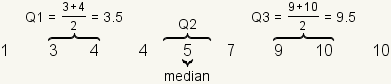
| | Figure 2: Quartiles |
|
A quartile is one of three values that
divides a dataset into four groups. Each group has the same number of
elements. The first quartile, also called
Q1, is a number between the lowest fourth
of the dataset and the 2nd fourth. The
second quartile, also called
Q2, is a number between the 2nd
fourth of the dataset and the 3rd fourth. The second quartile
(Q2) is the same as the
median
of the dataset. The third quartile, also called
Q3, is a number between the 3rd
fourth and the 4th fourth.
|
Quartiles and Percentiles
| Quartile | Percentile |
|---|
| Q1 | 25th |
| Q2 or median | 50th |
| Q3 | 75th |
| Table 1: Quartile and percentile. |
|
The first quartile, Q1, is the same as the 25th percentile.
The second quartile, Q2, is the same as the 50th percentile. The
third quartile, Q3 is the same as the 75th percentile.
|
Calculating Quartiles
To find the quartiles of a dataset, first find the
median
of the dataset. If the dataset has an odd number of elements, use the
middle number. If the dataset has an even number of elements, use the
arithmetic mean of the two middle numbers. This splits the dataset into
two equal parts. Neither part contains the median. The median is the
same as Q2.
Then take each half of the dataset and find the median of that half.
The median of the first half of the dataset is Q1. The median of the
second half of the dataset is Q3.
Examples
| Step | Figure | Description |
|---|
| 1 | 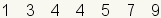 | This is the dataset to divide into quartiles. |
| 2 | 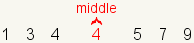 | Since the dataset has an odd number of elements, pick the middle element for the median (Q2). |
| 3 | 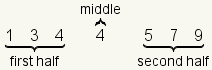 | The middle number divides the dataset into two halves. Since the middle number is the median, it is not included in either half. |
| 4 | 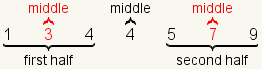 | Since each half contains an odd number of elements, pick the middle number in each half. |
| 5 | 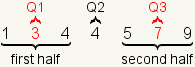 | The middle of the first half and second half are Q1 and Q3 respectively. |
| Table 2: Example 1 |
| Step | Figure | Description |
|---|
| 1 |  | This is the dataset to divide into quartiles. |
| 2 | 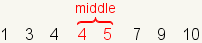 | Since the dataset has an even number of elements, pick the middle two elements to calculate the median (Q2). |
| 3 | 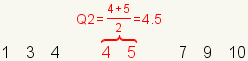 | The median (Q2) is the arithmetic mean of the middle two numbers. |
| 4 | 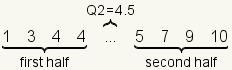 | The middle number divides the dataset into two halves. The two numbers used to calculate the median are included in the halves. |
| 5 | 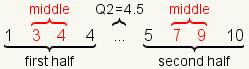 | Since each half contains an even number of elements, pick the middle two numbers in each half. |
| 6 | 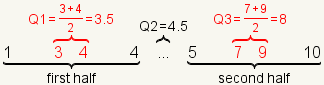 | Calculate Q1 as the arithmetic mean of the middle two numbers of the first half. Calculate Q3 as the arithmetic mean of the middle two numbers of the second half. |
| 7 | 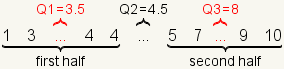 | For this dataset Q1=3.5, Q2=4.5, and Q3=8. |
| Table 3: Example 2 |
| Step | Figure | Description |
|---|
| 1 |  | This is the dataset to divide into quartiles. |
| 2 | 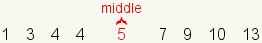 | Since the dataset has an odd number of elements, pick the middle element as the median. |
| 3 | 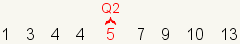 | Q2 is the same as the median. |
| 4 | 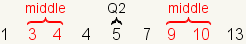 | Q2 divides the dataset into two halves. Since the halves have an even number of elements each, pick the middle two numbers of the halves. |
| 5 | 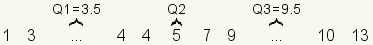 | Calculate Q1 and Q3 as the arithmetic mean of the middle two numbers. |
| Table 4: Example 3 |
References
- McAdams, David E.. All Math Words Dictionary, quartile. 2nd Classroom edition 20150108-4799968. pg 148. Life is a Story Problem LLC. January 8, 2015. Buy the book
Cite this article as:
McAdams, David E. Quartile. 12/21/2018. All Math Words Encyclopedia. Life is a Story Problem LLC. https://www.allmathwords.org/en/q/quartile.html.
Image Credits
Revision History
12/21/2018: Reviewed and corrected IPA pronunication. (
McAdams, David E.)
12/3/2018: Removed broken links, updated license, implemented new markup. (
McAdams, David E.)
1/12/2009: Initial version. (
McAdams, David E.)