
Statistics
Pronunciation: /stəˈtɪs.tɪks/ ExplainStatistics is the study of data. It includes collection, analysis, interpretation and presentation of the data. Statistics is useful in many areas of research, including biology, physics, marketing research, and many others.
The two main branches of statistics are descriptive statistics and inferrential statistics. Descriptive statistics describes the properties of populations, such as age or distribution. Inferrential statistics is used to make predictions of future events.
Some of the main elements of statistics are:
- Population: The entire group being studied. A statistical study identifies a population, such as 20-35 year olds interested in fitness, and finds common properties of the population.
- Sampling: The portion of the entire group that is surveyed is a sample. Getting a representative sample, a sample that fairly represents the entire population, is important in designing a valid statistical experiment. If a statisical study uses a convenience sample, the study is invalid.
- Probability: The study of how likely or how often something occurs. Probability theory is the mathematics underlying statistics.
- Experimental design: How an experiement (or study) is put together to make it valid. Using a convenience sample is an example of poor experimental design.
- Regression: Finding an equation that best describes the sample. Linear regression is a regression that tries to find a line that fits the sample.
- Classification: Dividing a population into various groupings. For example, a bank wants to lend money to those who will pay it back. Potential customers are classified according to the likelyhood that they will pay back the entire loan.
Statistics can be represented in a variety of ways. Some of the common ways are:
| Box and whisker plot | |
 |
A line representing the first quartile, two boxes representing the 2nd and 3rd quartile, and a line representing the 4th quartile. |
| Pie Chart | |
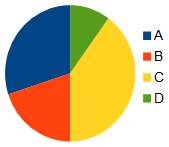 |
A circle divided into wedges where each wedge represents a portion of a population. |
| Bar Chart | 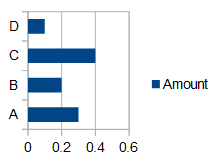 |
A set of adjacent rectangles where the height or width of each rectangle represents a quantity. |
| Histogram | |
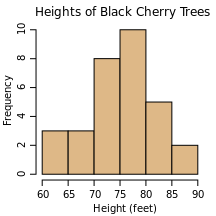 |
A set of adjacent, vertical rectangles where the hieght of each rectangle represents a quantity in a data range. |
| Scatter Plot | |
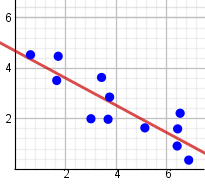 |
An x-y graph with various points plotted and a least squares fit line. |
References
- McAdams, David E.. All Math Words Dictionary, statistics. 2nd Classroom edition 20150108-4799968. pg 171. Life is a Story Problem LLC. January 8, 2015. Buy the book
Cite this article as:
McAdams, David E. Statistics. 1/19/2019. All Math Words Encyclopedia. Life is a Story Problem LLC. https://www.allmathwords.org/en/s/statistics.html.Image Credits
- All images and manipulatives are by David McAdams unless otherwise stated. All images by David McAdams are Copyright © Life is a Story Problem LLC and are licensed under a Creative Commons Attribution-ShareAlike 4.0 International License.
- Black cherry tree histogram: Mwtoews, commons.wikimedia.org. This file is licensed under the Creative Commons Attribution-Share Alike 3.0 Unported license. https://commons.wikimedia.org/wiki/File:Black_cherry_tree_histogram.svg.
Revision History
12/21/2018: Reviewed and corrected IPA pronunication. (McAdams, David E.)5/5/2011: Initial version. (McAdams, David E.)
- Navigation
- Home
- Contents
-
# A B C D E F G H I J K L M N O P Q R S T U V W X Y Z - Teacher Aids
- Classroom Demos
- How To
- LIASP
- LIASP Home
- Conditions of Use
- Privacy Policy
- Donate to LIASP
- Help build this site
- About LIASP
- Contact LIASP
All Math Words Encyclopedia is a service of
Life is a Story Problem LLC.
Copyright © 2018 Life is a Story Problem LLC. All rights reserved.
This work is licensed under a Creative Commons Attribution-ShareAlike 4.0 International License