
Solve Graphically
Pronunciation: /sɒlv ˈgræf.ɪ.kə.lɪ/ ExplainAn equation can be solved graphically by graphing the equation on a graphing device, then reading the x-value of the equation where it crosses the y-axis. A graphical solution is not exact, but is an approximation. Typically one 'zooms in' on the x-intercept until the value can be read with sufficient accuracy.
| Iteration | Graph | Description |
|---|---|---|
| 1 | 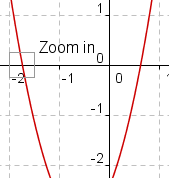 | This is the initial graph. We will be finding the solution of the equation between -1 and -2. |
| 2 | 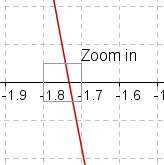 | When we zoom in on the x-intercept, we can see that the root is between -1.7 and -1.8. |
| 3 | 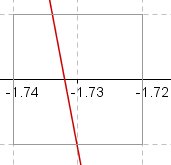 | As we zoom in again, we can see that the root is between -1.73 and -1.74. |
| 4 | 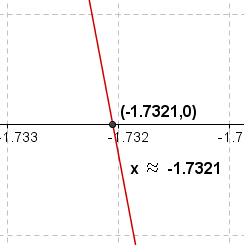 | As we zoom in once more, the root is between -1.732 and -1.733. Since it is about 1/10 the way from -1.732 and -1.733, the value of the root is approximately -1.7321. |
| Example 1 | ||
References
- McAdams, David E.. All Math Words Dictionary, solve graphically. 2nd Classroom edition 20150108-4799968. pg 168. Life is a Story Problem LLC. January 8, 2015. Buy the book
Cite this article as:
McAdams, David E. Solve Graphically. 12/21/2018. All Math Words Encyclopedia. Life is a Story Problem LLC. https://www.allmathwords.org/en/s/solvinggraphically.html.Image Credits
- All images and manipulatives are by David McAdams unless otherwise stated. All images by David McAdams are Copyright © Life is a Story Problem LLC and are licensed under a Creative Commons Attribution-ShareAlike 4.0 International License.
Revision History
12/21/2018: Reviewed and corrected IPA pronunication. (McAdams, David E.)12/10/2018: Removed broken links, updated license, implemented new markup. (McAdams, David E.)
2/6/2009: Initial version. (McAdams, David E.)
- Navigation
- Home
- Contents
-
# A B C D E F G H I J K L M N O P Q R S T U V W X Y Z - Teacher Aids
- Classroom Demos
- How To
- LIASP
- LIASP Home
- Conditions of Use
- Privacy Policy
- Donate to LIASP
- Help build this site
- About LIASP
- Contact LIASP
All Math Words Encyclopedia is a service of
Life is a Story Problem LLC.
Copyright © 2018 Life is a Story Problem LLC. All rights reserved.
This work is licensed under a Creative Commons Attribution-ShareAlike 4.0 International License